The grid screen is the main results screen. Most of the time it is the place where we start dealing with the results of the Queries we run.
You can watch a short overview video of the InSights Into Data Grids - here
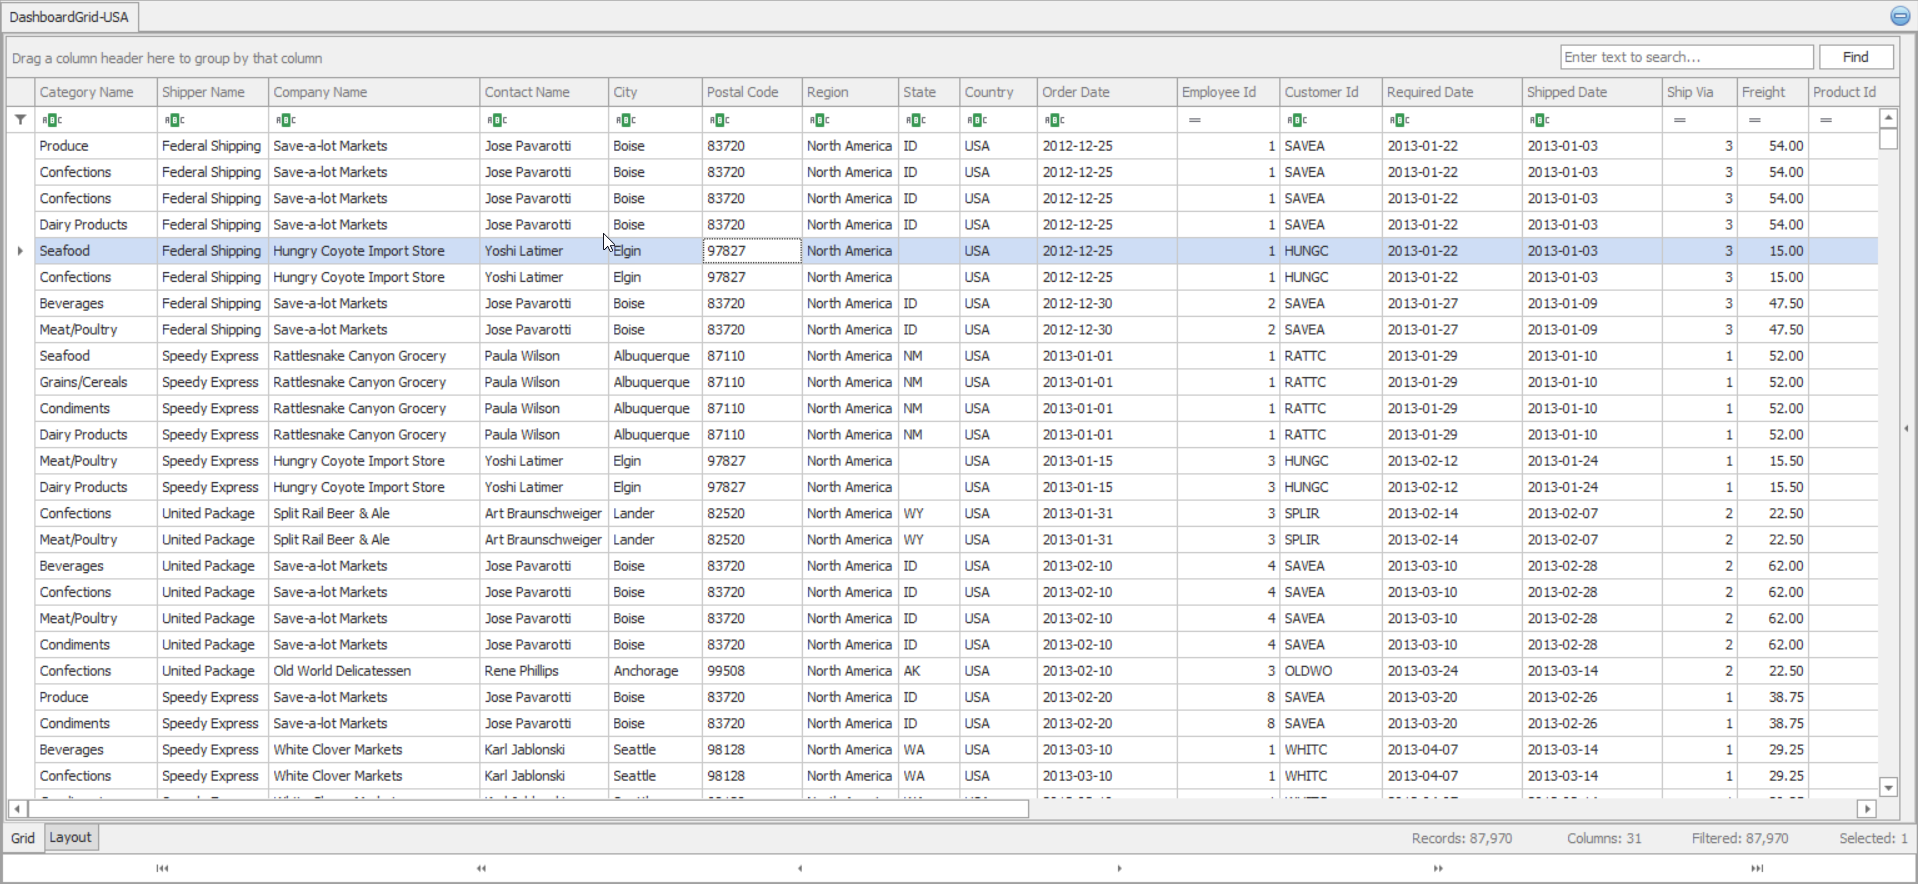
This is where the data table is displayed in rows and columns. You can explore the details of your data here in the Grid. You can Sort, Filter, Search, etc. You have the ability to create Groups and take actions on them such as counting and summing, etc. You can conditionally highlight the data, create charts from the highlighted records, and more.
From this screen you can launch the Pivot Grid, Dashboards, Reports, Exports, etc.