The pivot grid screen allows you to really explore your data and twist it using pivots and cross tabs to view it in ways not possible in standard grids.
You can watch a short overview video of the Pivot Grids in InSights Into Data - here.
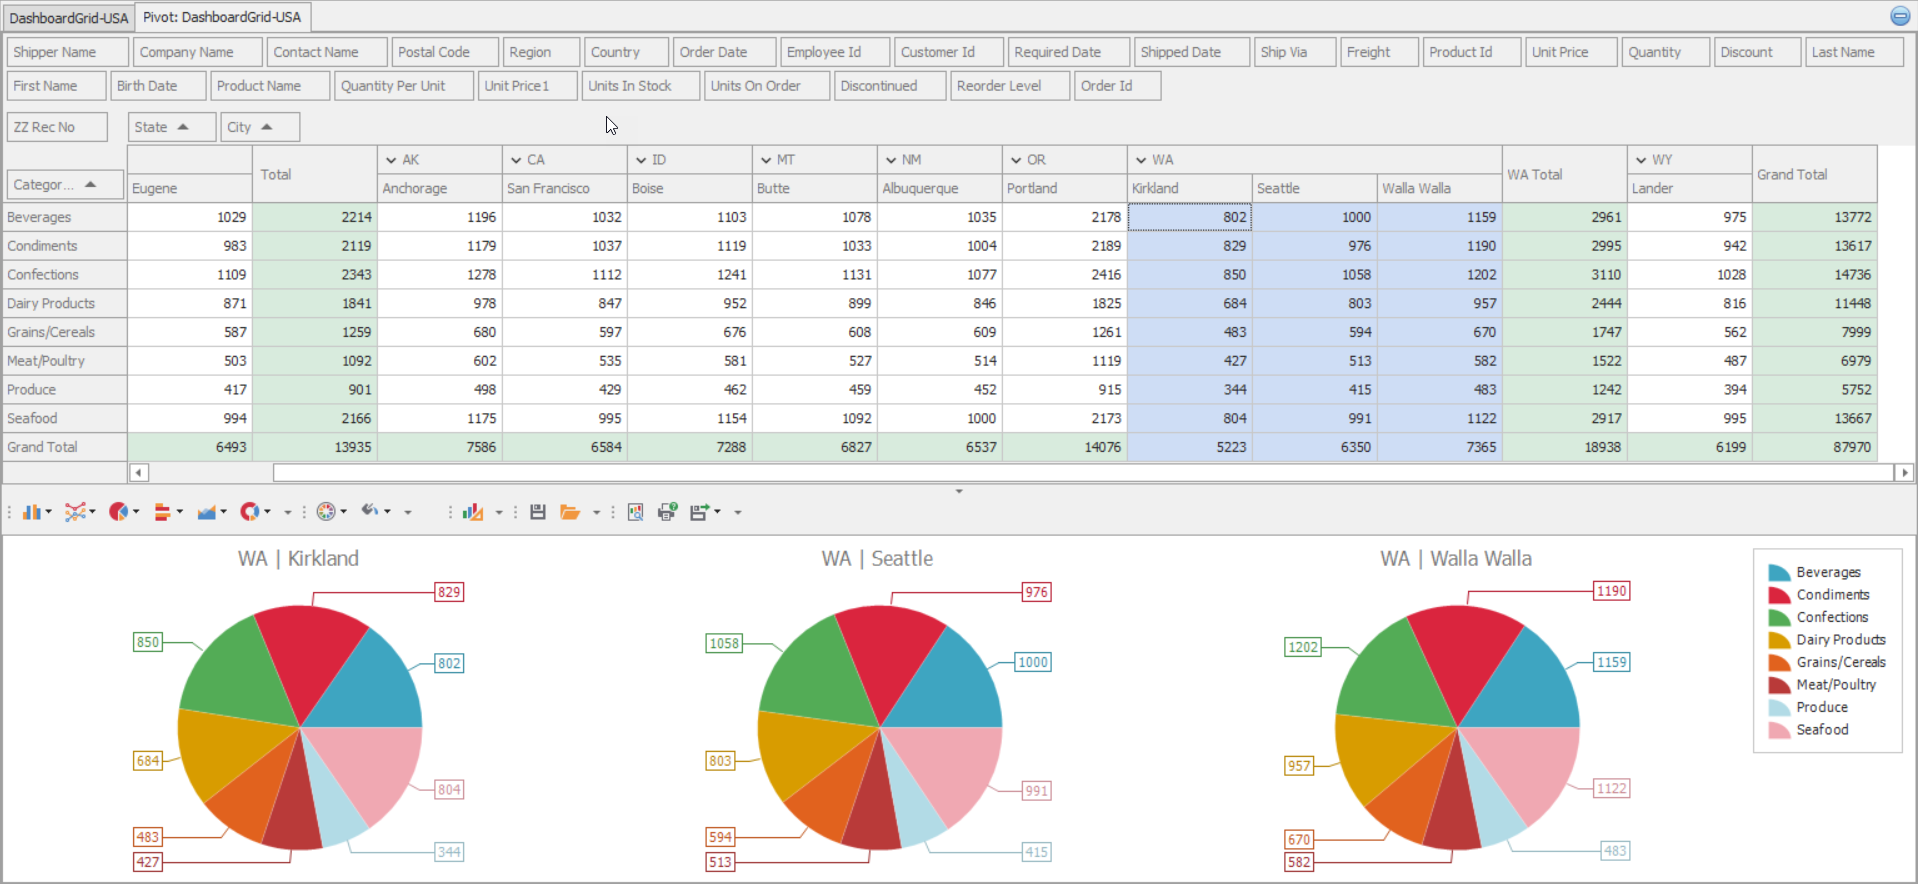
The Pivot Grid, as shown below, shows how you can create cross tab views of your data. It is done by dragging fields from the top area into the cross tab area just below. This in turn automatically creates the cross tab grid, and when you highlight records, the program automatically creates the charts shown in the screen capture below.