InSights Into Data has a very robust dashboard solution. You are able to design and use dashboards against any dataset you can import.
The program has both a dashboard designer and a dashboard viewer. The viewer is what most users will interact with while using InSights Into Data. The designer is what is used to create the dashboards that most users will then use to visualize their data.
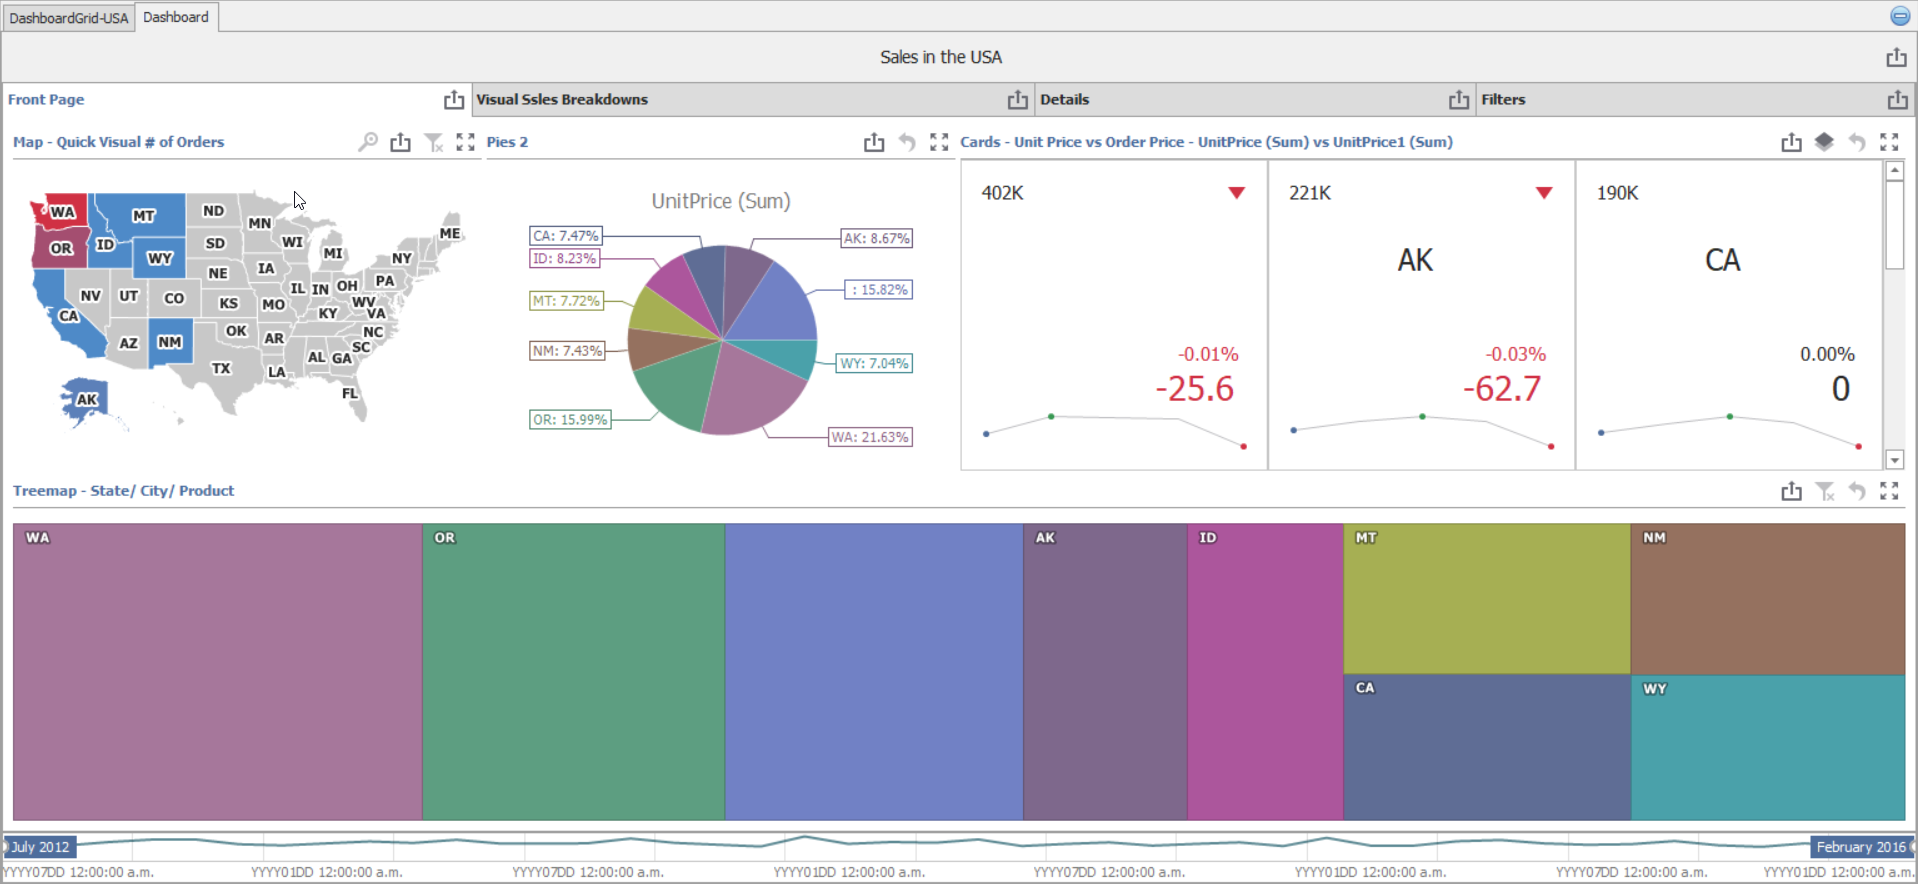
Dashboard Viewer
You can read some detailed documentation about InSights Into Data's dashboard viewer here
The dashboard viewer allows you to explore your data visually, using just point and click. It is incredibly easy to use! The following screen shot shows one of the dashboards that ships with InSights Into Data. It is a multi-tabbed dashboard that allows the user to explore the orders that ship in the database with InSights Into Data.
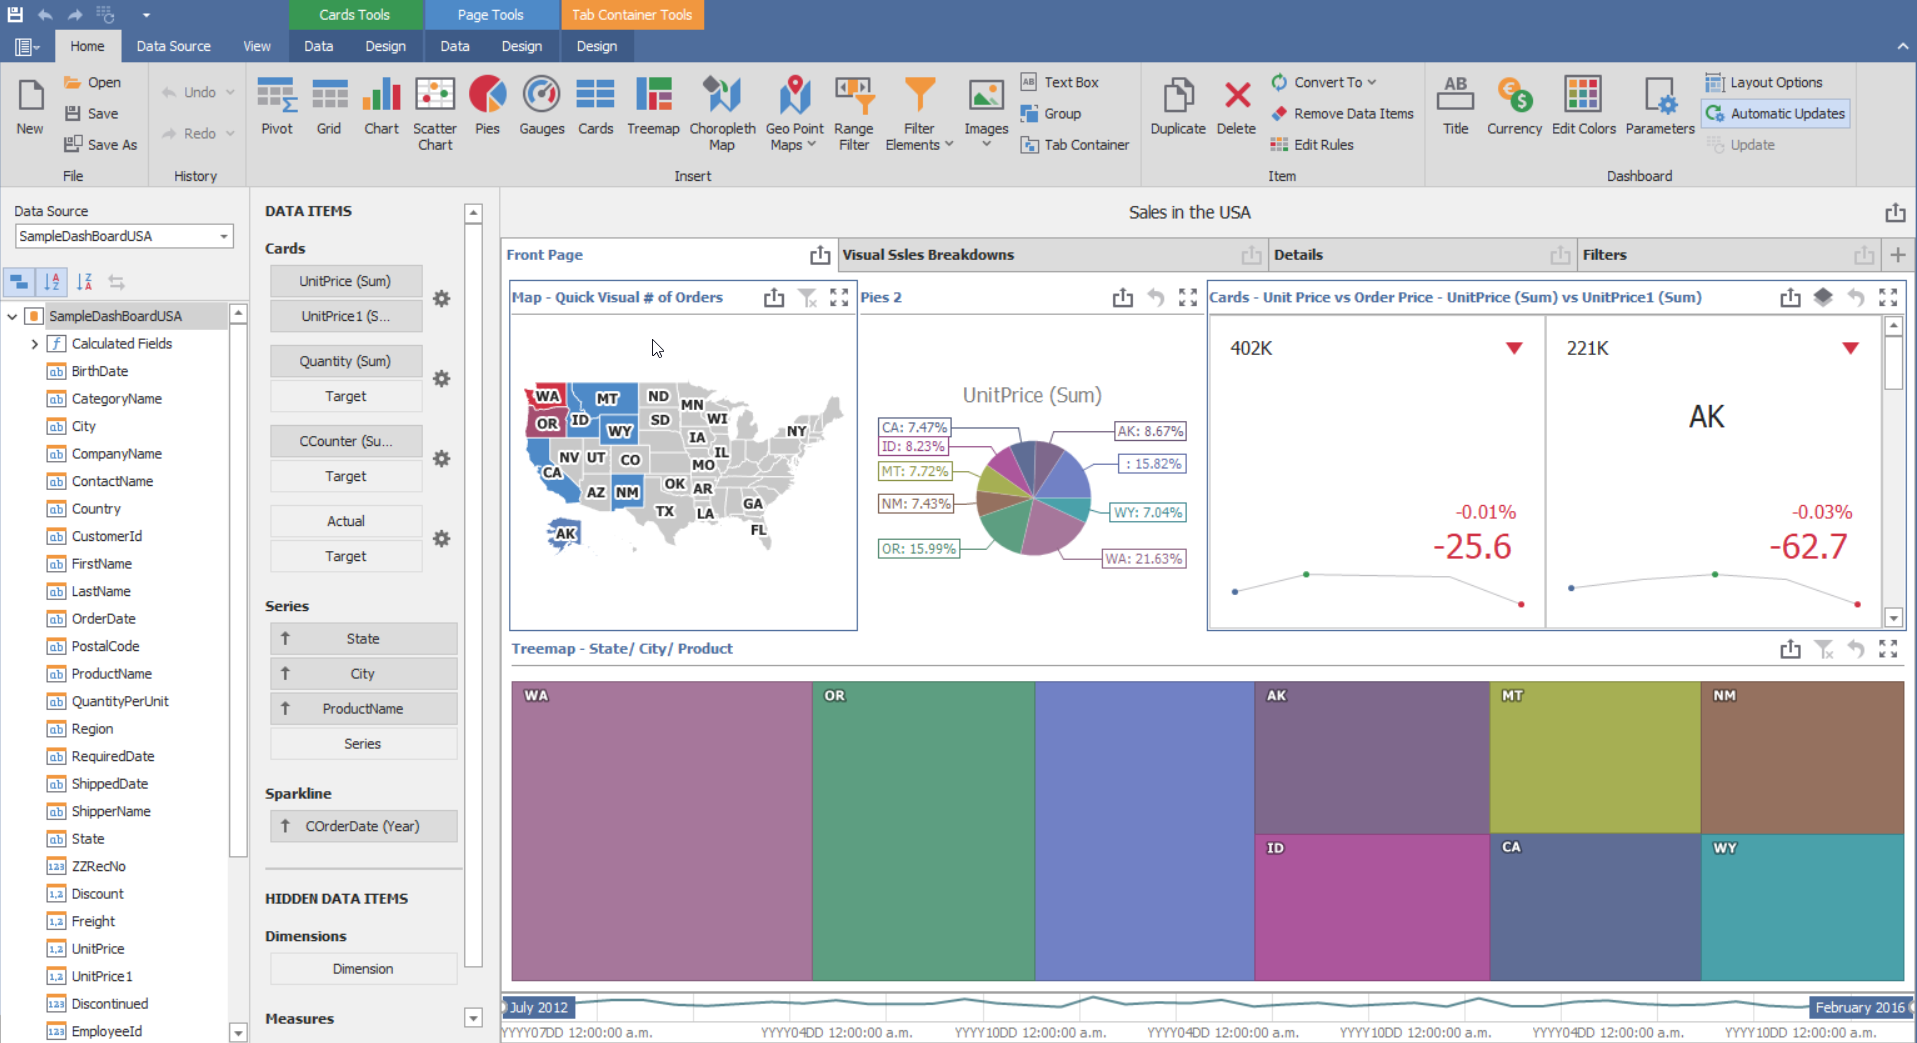
Dashboard Designer
You can read some detailed documentation about InSights Into Data's dashboard designer here
The dashboard designer allows you to create interactive dashboards that can be used by anyone who has access to the Query.
The dashboard designer works with live data, so that you can see the results of your work immediately. You can work with various chart types, grids, pivot grids, cards, maps, etc. It allows you various ways to filter your data, as well as providing grouping and tab controls.
When you want to save your design changes - you close the designer by using the Red X in the upper right hand corner. Then you will be asked if you want to save any changes.