The Data Trending capabilities of InSights Into Data is very, very flexible. It allows you to trend whatever data you want over multiple data tables over a date field of your choosing.
To start the trending process - you have to have 2 or more data tables in the Results Tab. At this point a new button group will appear that shows the compare and trending buttons.
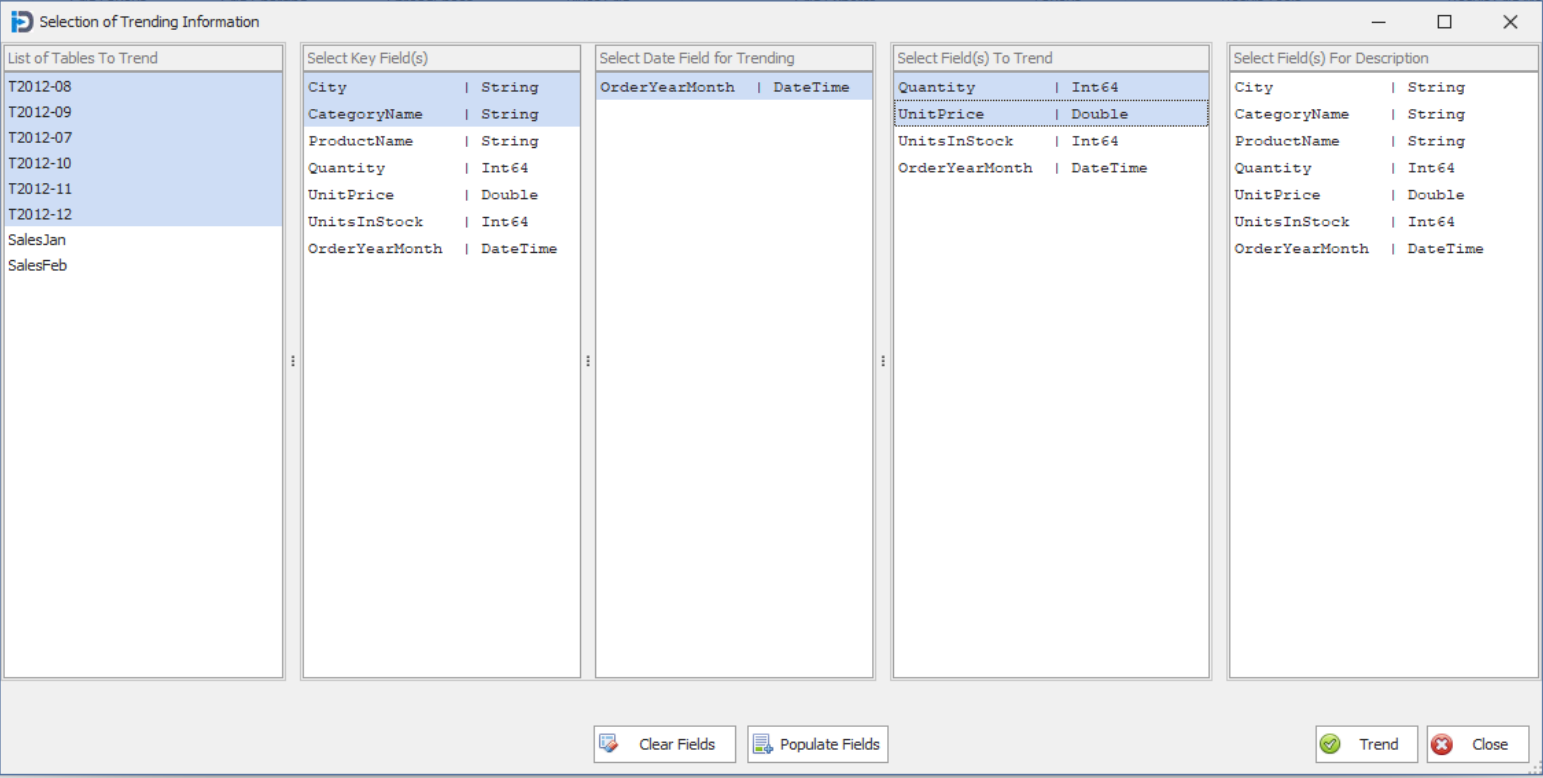
When you click on the Trend Multiple Tables button - you will see the following screen. At first you will only have the List of Tables To Trend list box with anything in it. Here you select the data tables you would like to trend. Once that is done - you select the populate fields buttons. This will create all the field in each of the next four list boxes.
Select Key Fields: this list box is used to select which fields you want to use as key fields. This means that you want to Trend the data by these fields. (The line charts will be based on the values for these fields.
Select Date Field for Trending: this list box allows you to select the data field you want to trend the values over.
Select Field(s) to Trend: this list box allows you to select all the numeric fields you want to allow trending for. In the example below we have selected Quantity and UnitPrice.
Select Field(s) for Description: this list box allows you to select additional fields to provide more meaning to your grid on the following screen.
When you have selected your fields - and are ready - you can click the Trend button - and the following screen will appear.
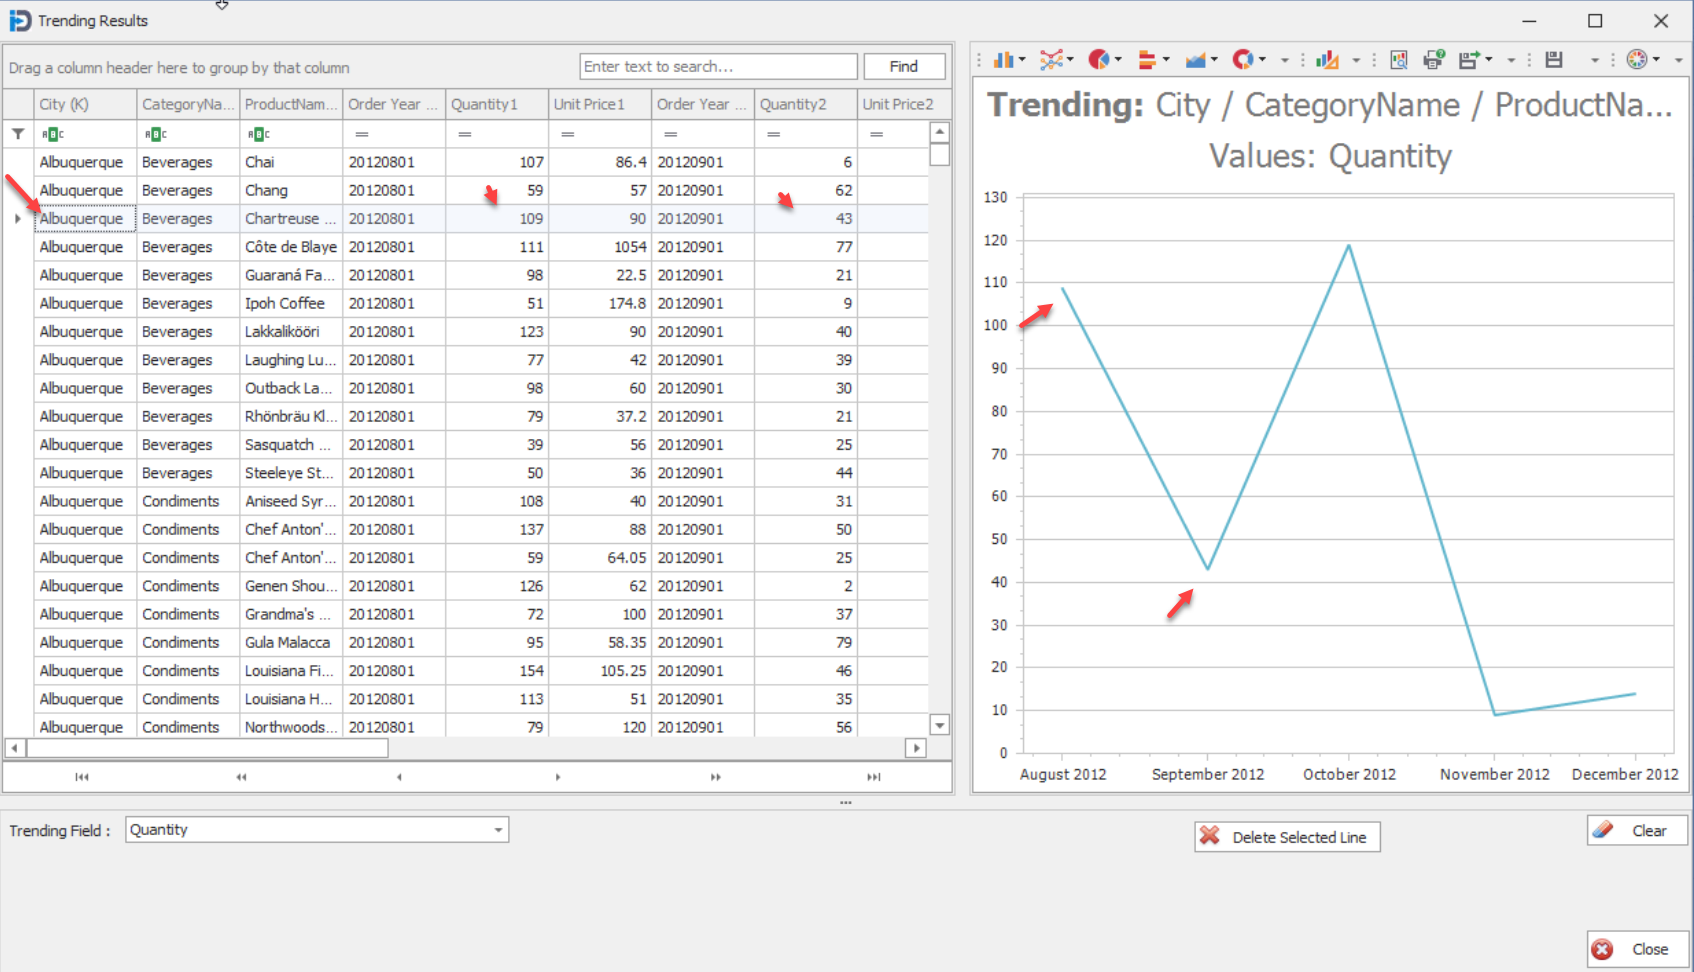
When if first shows up - no record is selected in the grid - and the chart to the right will be blank. As you select records in the grid - by clicking on them - they will automatically create line charts in the chart to the right. In the image below - you can see that we have selected the Albuquerque and Beverages record - and note that it has automatically created the first line in the chart to the right.
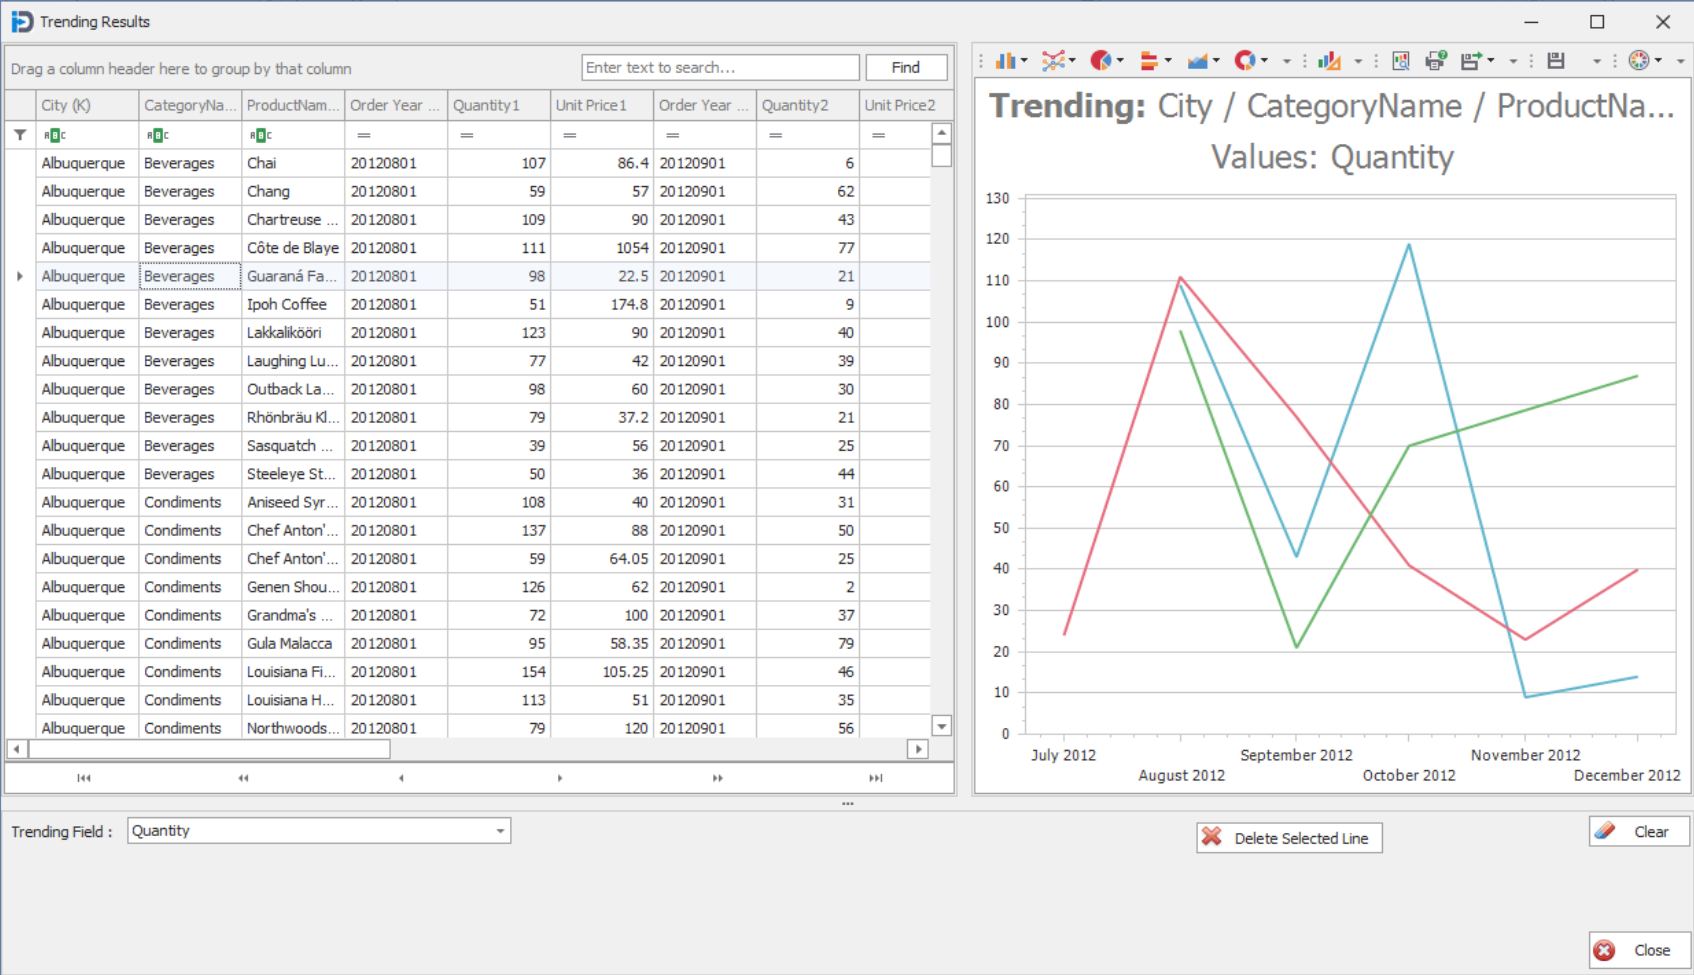
In the chart - you can see that the program has created a new dataset - showing the fields you selected - but then adding extra fields (Date and values) for each table you selected to trend. This allows you to see the details of the trending records that you have selected to compare - in one record.
After clicking a few records in the grid - you screen might look like the one shown below. Here you can see we have the chart on the right hand side of the screen showing the line charts for three different city/category/product combinations.