A unique feature of InSights Into Data is its ability to visually compare two data tables. This can be incredibly useful when you want to see what has changed between two sets of data! Imagine being able to compare the differences between two different months of Order data.
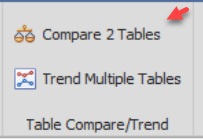
To utilize this feature - you must have at least 2 different data tables in memory. Once that occurs a new section will appear in the Results tab of the Ribbon Bar at the top of the screen. That section looks like the following screen capture. To start the compare process - you can click on the button labeled "Compare 2 Tables"
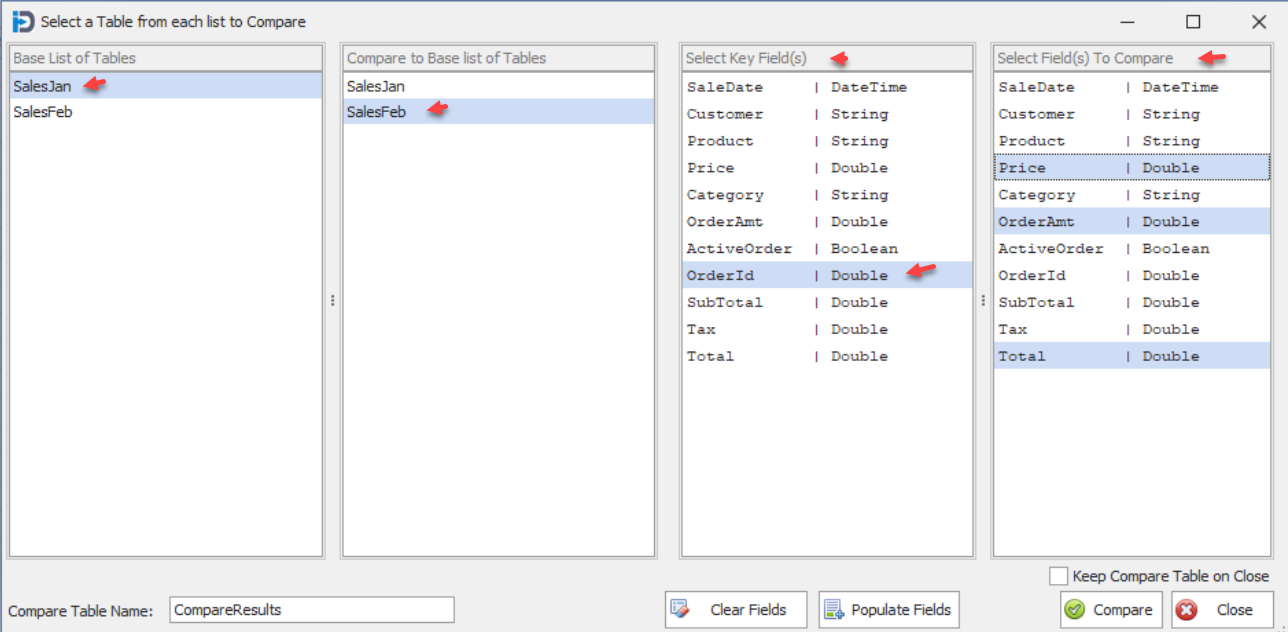
Once you click on the button shown above, the following screen will appear. This screen will show two lists of tables - with the two field lists on the right being blank (i.e. no fields listed).
In the example below, you see two tables listed - one for January Sales and one for February Sales. You select one as being the base - and the other as being the one to compare to the base. Once you have done that, click the Populate Fields buttons - and the program will auto populated the two list boxes the right with the fields that are common to both tables.
In the two list boxes to the right - you need to specify first the field(s) that make up a unique key to the tables. In this case - we are using the Order ID field - as it uniquely identifies each records in the tables.
In the second (and right most) list box - we have selected the fields that we will allow the user to compare between the two tables.
Once you have done this - you can click the Compare button - and it will take you to the next screen.
One option is a check box just above the compare button - that allows you to keep the comparison table that is created upon close of the form. This compare table is built during the compare process and might be of use for further analysis, if the user so wishes.
The Compare Table Name field allows you to name the compare table in order to keep the naming unique - which is a requirement.
The screen capture below shows the results of clicking the Compare Button. The first shown, is the ROW compare (note the selection in the drop down in the lower left hand corner of the form). This row compare shows which rows have been added (light Blue background), which records have been deleted (light Orange background) - and which records have had some sort of change (light Purple background).
The table shows each of the common columns, along with new columns :
- Row Status - shows the Compare status of the row. DEL, CHG, and NEW are the possible values.
- A Change Type field for each compare field (DEC and INC)
- A Change Amount field - showing how much the field changed. It the field is a string field - it just shows as changed.
- A Compare Value field - for each compare field - showing the value that was compared against the Base or original value.
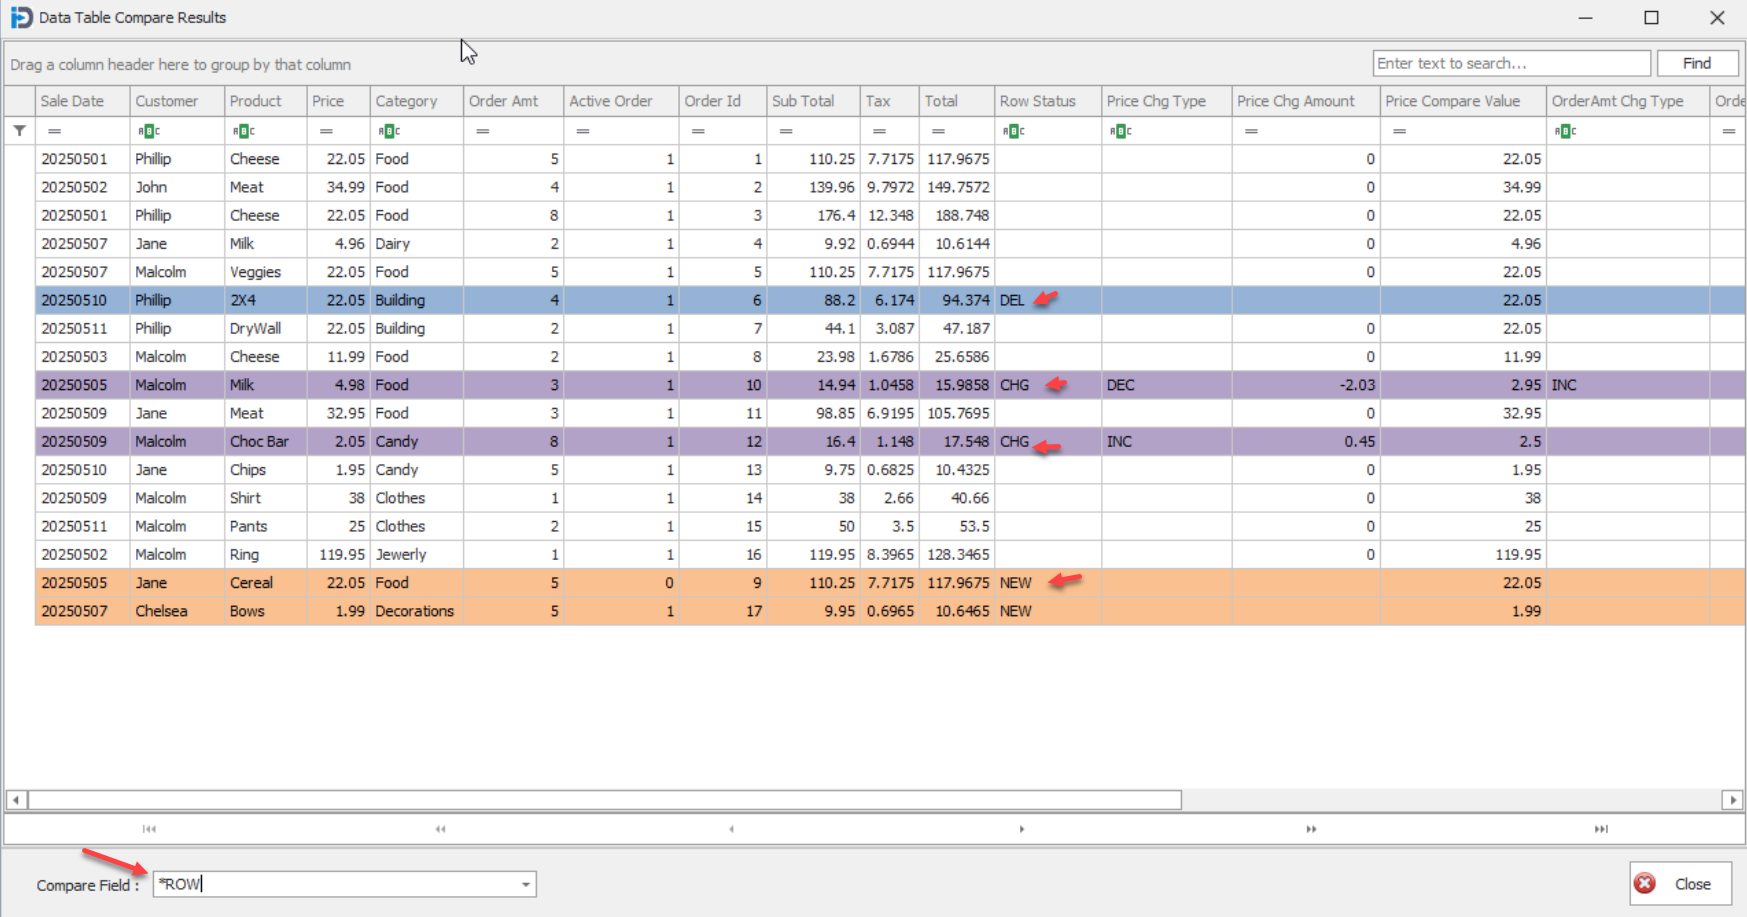
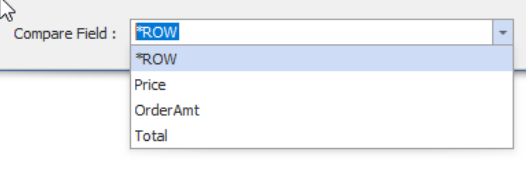
The drop down in the lower left hand corner - allows the user to choose how the data will be compared. When the screen is first shown this field is set to *ROW - which means it is doing a comparison at the record level - not the field level. That is what is shown in the screen capture above.
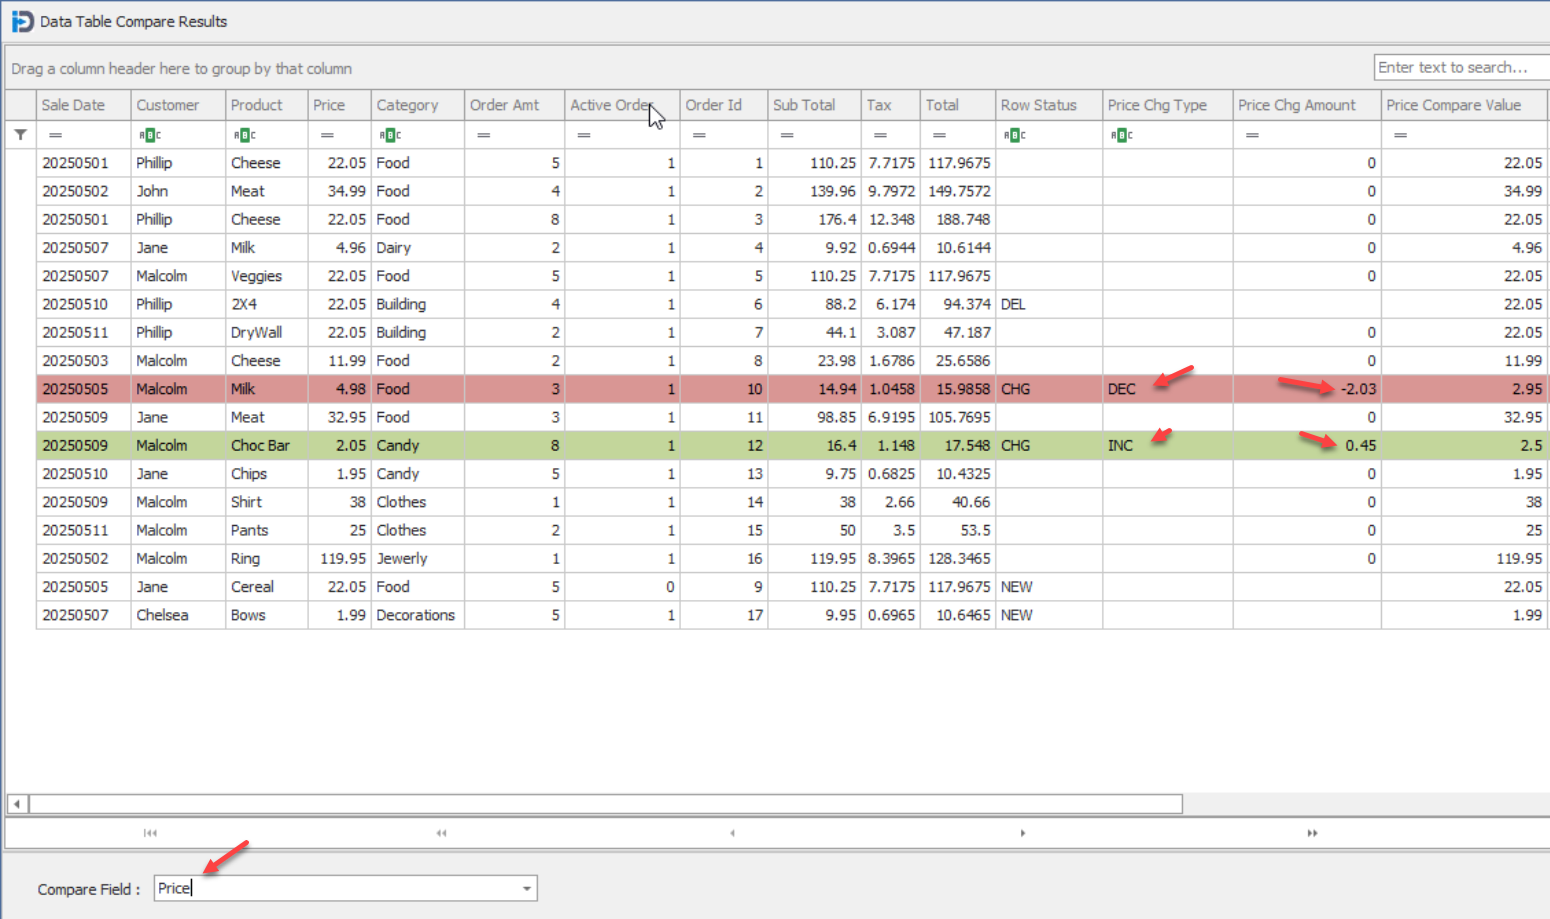
The drop down will be populated with each field you choose to be able to compare on. In this case it is Price, Order Amt, and Total.
Let's choose Price from the drop down - and the screen will change as shown. Here you can notice that the colouring has changed. This is because the comparison is no longer at the row level - but is now being done on the price field. You can see that the program is able to visually indicate that the price of the Milk has decreased (Red highlight) while the price of the Choco Bar has increased (Green highlight)